
HepCURE × Gilead

Program Briefing

Confidential report

Do not copy or distribute
HepCURE

Q2 2026 PresentationGilead Collaborative Project

0%
Slide Navigation64 slides
Click any slide number below to jump directly to that slide. Every slide includes a “↑ Back to Navigation” button at the top that returns you here.
POCT Utilization (HCV)
INHSU 2026 Abstract
↑ Top
Section 01

Overview

Slides 1 – 6
Top
01of 12
Overview
Agenda
  • 01Organizational structure
  • 02Q1 & Q2 performance dashboards
  • 03HCV cascade of care · Q1 & Q2
  • 04Treatment timing, territory
    & Cepheid results
  • 05SWOT — strengths, weaknesses, opportunities, threats
  • 06Gilead roles, financial accountability
    & next steps
HepCUREConfidential — Do not copy or distribute


Team Structure
Organizational Chart
Clinical Flow
Judith Timothy
Nurse Practitioner
Nurse Practitioner reviews all cases and refers to appropriate HCV providers depending on patient choice and geography.
Admin & Finance
Olumide Llori
Manager, Payroll & Accounting
Reports directly to Cofounder & Director.
Management Flow
Joséphine Saint Amour
Cofounder & Director
Ontario
Team 1 · Outreach
Racquel Anthony
Director, Partnerships
& Mobile Unit Lead
MacKenzie King
Outreach Staff
Team 2 · Outreach
George Holness
Mobile Unit Lead
Zoya Badenock
Outreach Staff
British Columbia
Planned outreach expansion
Targeted by end of Q3 2026
HepCUREConfidential — Do not copy or distribute

Program Highlights
Year-to-Date 2026
Executive Snapshot
2,590
Clients ScreenedTotal client registrations
RNA Positive Prevalence
415 · 16.0%
1.6 out of every 10 clients screened
confirmed RNA-positive

350 of 415 linked to care · 84.3% linkage rate
Clinical Assessments
3,450 · 1.33 / client
HCV & HIV POCT + Cepheid + DBS tests performed
1.33 assessments on average — demonstrating our multi-modal screening effectiveness
Cities Visited
29 · avg 4 / month
unique Ontario communities engaged
through HepCURE mobile outreach
Outreach Days
144 · avg 21 / month
dedicated screening days in the field
HepCUREConfidential — Do not copy or distribute
Program Performance
Year-to-Date 2026
Registrations by Disposition Group
Program-Wide Scorecard
January – July 2026Team 1 + Team 2 · combined YTD scorecard
2,590 total registrations
Case management
current as of
July 17, 2026
Ab+1,108 · 42.8%
Ab−1,482 · 57.2%
84.3%Linked to Care
350 of 415 RNA-positive clients successfully linked to care across 2,590 program-wide registrations year-to-date — Team 1 + Team 2 combined, Jan–Jul 2026.
Group 1POCT Negative1,482 · 57.2%
  • POCT Incomplete34
  • POCT Neg1,448
Group 2RNA Positive415 · 16.0%
  • Active183
  • Active-3 Weeks2
  • Active-Bridge71
  • Active-Lost29
  • Ambassador4
  • Cepheid1
  • Compassionate1
  • Completed27
  • Consult Req15
  • Cured11
  • Delivery6
  • External Tx9
  • HIV Patient3
  • Jail1
  • Manual Claim2
  • Missing Drug1
  • Missing RNA18
  • NIHB1
  • No Coverage1
  • No OHIP2
  • Not Ready7
  • Refused Tx4
  • Rx1
  • SOT4
  • Trillium2
  • Unable to Tx9
Group 3RNA Negative651 · 25.1%
  • Previously Tx399
  • Self-Cured252
Group 4RNA Pending22 · 0.8%
  • BW RLTS22
Group 5RNA Required20 · 0.8%
  • BW Req2
  • Cepheid3
  • Lab Req9
  • Refused BW2
  • Resistance4
Program-wide basis: Combines Team 1 (1,773 registrations, Jan–Jun; no field activity Jul) and Team 2 (817 registrations, Jan–Jul). Individual team YTD scorecards appear on Slides 22 (T1) and 31 (T2).
HepCUREConfidential — Do not copy or distribute
Program Performance
Year-to-Date 2026
Linked-to-Care
Program-Wide Scorecard
January – July 2026Team 1 + Team 2 · RNA-positive care pathway
415 positive clients
Case management
current as of
July 17, 2026
Linked350 · 84.3%
In Prog14 · 3.4%
Unable25 · 6.0%
Lost19 · 4.6%
Group ALinked to Care350 · 84.3%
  • Active209
  • Active-3 Weeks2
  • Active-Bridge46
  • Active-Lost29
  • Ambassador3
  • Compassionate1
  • Completed26
  • Cured12
  • Delivery6
  • External Tx9
  • Manual Claim2
  • Rx1
  • SOT4
Group BIn Progress14 · 3.4%
  • Consult Req11
  • Missing Drug1
  • Trillium2
Group CUnable to Tx25 · 6.1%
  • HIV Patient2
  • No Coverage1
  • No OHIP2
  • Not Ready7
  • Refused Tx4
  • Unable to Tx9
Group DLost to Follow Up19 · 4.6%
  • Jail1
  • Missing RNA18
Care-pathway basis: Combines Team 1 (223 RNA-positive, Jan–Jun; no field activity Jul) and Team 2 (192 RNA-positive, Jan–Jul) into a single program-wide care-pathway view. Each RNA-positive client is mapped to Linked / In Progress / Unable / Lost per the HepCURE case-management framework. Percentages calculated against the 415-client program-wide RNA-positive total. Individual team scorecards appear on Slides 23 (T1) and 32 (T2).
HepCUREConfidential — Do not copy or distribute
Program Performance
Year-to-Date 2026
Clinical Assessments
Program-Wide Scorecard
Program-WideTeam 1 + Team 2 · Jan–Jul 2026
3,450 total assessments
Group 1HCV · POCT1,680 · 48.9%
  • Neg (Ab−)1,452
  • Pos (Ab+)228
Group 2HIV · POCT490 · 14.2%
  • Neg (Ab−)485
  • Pos (Ab+)5
Group 3Cepheid508 · 14.7%
  • Pos304
  • Neg184
  • Other20
Group 4DBS772 · 22.4%
  • Pos293
  • Neg392
  • Pending79
  • Other8
Reporting basis: Program-wide roll-up of Team 1 + Team 2 monthly clinical activity, Jan–Jul 2026 — reconciled to the dedicated utilization sections (Slide 10 · Cepheid, Slide 13 · DBS, Slide 16 · POCT HCV, Slide 19 · POCT HIV). Sub-category counts within each group are sourced directly from those authoritative YTD scorecards. Clients may have received multiple assessment types in the same period, so this count of tests performed is not comparable to the 2,590 client registrations shown on Slide 3 — some registered clients arrive with prior known Ab+/Ab− status and do not require an on-site POCT test.
HepCUREConfidential — Do not copy or distribute
Section 02

Screening Cities

Slides 7 – 9
Top
02of 12
Territory Coverage
Program YTD Summary
Screening Cities
Program (Team 1 + Team 2) · Jan–Jul 2026
TotalScreening Days144Jan–Jul 202629 unique cities · avg 21 days/mo
Q1 · Jan–Mar
69avg 23/mo
T1 43 · T2 26
Q2 · Apr–Jun
65avg 22/mo
T1 33 · T2 32
Q3 · Jul
10T2 only
T1 not in field · T2 rotated Northern Ontario
Team split: Team 1 covered 76 days (Jan–Jun · Northern & GTA-East territory) · Team 2 covered 68 days (Jan–Jul · Southwestern & Northern Ontario).
Top cities by screening days (program-wide, Jan–Jul): London 18 · Chatham 13 · Sudbury 8 · Sault Ste. Marie 8 · Windsor 8 · Ottawa 7 · Hamilton 6 · Peterborough 6 · Kitchener 6 · Barrie 5 · Belleville 5 · Kingston 5 · Oshawa 5 · St. Thomas 5 · Thunder Bay 5 · Midland 4 · Toronto 4 · Cambridge 3 · Niagara Falls 3 · North Bay 3 · Sarnia 3 · St. Catharines 3 · Brantford 2 · Timmins 2 · Wallaceburg 2 · Woodstock 2 · Leamington 1 · Newmarket 1 · Welland 1
HepCUREConfidential — Do not copy or distribute
Territory Coverage · Team 1
Screening Cities by Month — Team 1 YTD
76 screening days across Jan–Jun 2026 (Q1: 43 · Q2: 33). Team 1 was not in the field in July; regular schedule resumes Aug 2026.
Jan12 days
  • Barrie1
  • Midland2
  • Newmarket1
  • Toronto2
  • Oshawa2
  • Niagara Falls1
  • St. Catharines1
  • Hamilton1
  • Brantford1
Feb16 days
  • Oshawa2
  • Niagara Falls1
  • St. Catharines1
  • Belleville2
  • Hamilton2
  • Kitchener1
  • Cambridge1
  • Peterborough2
  • Ottawa2
  • Kingston2
Mar15 days
  • Oshawa1
  • Peterborough2
  • Belleville1
  • Hamilton1
  • Brantford1
  • Kitchener1
  • Cambridge1
  • Toronto1
  • Barrie2
  • Midland2
  • Welland1
  • St. Catharines1
Apr11 days
  • Peterborough2
  • Kitchener1
  • Sudbury3
  • Sault Ste. Marie3
  • Timmins2
May11 days
  • Kingston2
  • Ottawa3
  • Belleville1
  • Sudbury3
  • Toronto1
  • Niagara Falls1
Jun11 days
  • Sault Ste. Marie4
  • Sudbury1
  • Barrie2
  • Kitchener2
  • Hamilton2
Q2 shift into Northern Ontario: April–June saw the addition of Sudbury (7 total days), Sault Ste. Marie (7), and Timmins (2) — new Northern territories not covered in Q1.
HepCUREConfidential — Do not copy or distribute
Territory Coverage · Team 2
Screening Cities by Month — Team 2 YTD
68 screening days across Jan–Jul 2026 (Q1: 26 · Q2: 32 · Q3: 10). Cities span Southwestern, Eastern, and Northern Ontario.
Jan15 days
  • London5
  • St. Thomas2
  • Woodstock2
  • Ottawa2
  • Cambridge1
  • Kitchener1
  • Kingston1
  • Belleville1
Feb7 days
  • Chatham4
  • Windsor1
  • London1
  • St. Thomas1
Mar4 days
  • Chatham4
Apr8 days
  • London3
  • St. Thomas1
  • Chatham1
  • Windsor1
  • Leamington1
  • Sarnia1
May9 days
  • London5
  • Windsor3
  • Chatham1
Jun15 days
  • London4
  • Windsor3
  • Chatham3
  • Sarnia2
  • Wallaceburg2
  • St. Thomas1
Jul10 days
  • Thunder Bay5
  • North Bay3
  • Sudbury1
  • Sault Ste. Marie1
Northern Ontario push in July: after Southwestern-Ontario focus in Q1–Q2 (London, Chatham, Windsor being the anchor cities), Team 2 rotated into Northern Ontario for Jul — Thunder Bay 5 · North Bay 3 · Sudbury 1 · Sault Ste. Marie 1.
HepCUREConfidential — Do not copy or distribute
Section 03

Cepheid Utilization

Slides 10 – 12
Top
03of 12
Confirmatory Testing
Program YTD Summary
Cepheid Results
Program (Team 1 + Team 2) · Jan–Jul 2026
TotalCartridges508Jan–Jul 2026avg 73 total /mo
Positive
30459.8%
of 508 assessments
Negative
18436.2%
of 508 assessments
Other
203.9%
13 error · 3 invalid · 1 training · 1 <100 · 1 >100 · 1 pending
Q1 · Jan–Mar
257avg 86 /mo
Pos 150 · 58.4%  ·  Neg 97 · 37.7%  ·  Other 10 · 3.9%
Q2 · Apr–Jun
224avg 75 /mo
Pos 139 · 62.1%  ·  Neg 76 · 33.9%  ·  Other 9 · 4.0%
Q3 · Jul
27avg 27 /mo
T2 only · T1 not in field · Pos 15 · 55.6% · Neg 11 · 40.7% · Other 1 · 3.7%
Cepheid Utilization — Program
January – June (2026)
Team 1 + Team 2 combined
PositiveNegativeOther
Avg 48 positive /mo
46
Jan
35
1
54
Feb
28
5
50
Mar
34
4
47
Apr
31
1
36
May
18
6
56
Jun
27
2
Positive289 · 60.1%
Negative173 · 36.0%
Other19 · 3.9%
Cepheid Utilization — Program
July – December (2026)
Jul: Team 2 only (T1 not in field)
15
Jul
11
1
Aug
Sep
Oct
Nov
Dec
Positive15 · 55.6%
Negative11 · 40.7%
Other1 · 3.7%
HepCUREConfidential — Do not copy or distribute
Confirmatory Testing · Team 1
Cepheid Results — Team 1 · Jan–Jul 2026
TotalCartridges274Jan–Jun 2026 · Jul: not in fieldavg 46 total /mo
Positive
16861.3%
of 274 assessments
Negative
10136.9%
of 274 assessments
Other
51.8%
4 error · 1 >100
Q1 · Jan–Mar
134avg 45 /mo
Pos 80 · 59.7%  ·  Neg 50 · 37.3%  ·  Other 4 · 3.0%
Q2 · Apr–Jun
140avg 47 /mo
Pos 88 · 62.9%  ·  Neg 51 · 36.4%  ·  Other 1 · 0.7%
Q3 · Jul
0not in field
Mobile outreach team not deployed in July 2026
Cepheid Utilization
January – June (2026)
PositiveNegativeOther
Avg 28 positive /mo
13
Jan
8
1
26
Feb
19
2
41
Mar
23
1
34
Apr
25
22
May
8
1
32
Jun
18
Positive168 · 61.3%
Negative101 · 36.9%
Other5 · 1.8%
Cepheid Utilization
July – December (2026) · Jul: not in field
Jul
Aug
Sep
Oct
Nov
Dec
Positive0 · not in field
Negative0 · not in field
Other0 · not in field
HepCUREConfidential — Do not copy or distribute
Confirmatory Testing · Team 2
Cepheid Results — Team 2 · Jan–Jul 2026
TotalCartridges234Jan–Jul 2026avg 33 total /mo
Positive
13658.1%
of 234 assessments
Negative
8335.5%
of 234 assessments
Other
156.4%
9 error · 3 invalid · 1 training · 1 <100 · 1 pending
Q1 · Jan–Mar
123avg 41 /mo
Pos 70 · 56.9%  ·  Neg 47 · 38.2%  ·  Other 6 · 4.9%
Q2 · Apr–Jun
84avg 28 /mo
Pos 51 · 60.7%  ·  Neg 25 · 29.8%  ·  Other 8 · 9.5%
Q3 · Jul
27avg 27 /mo
Pos 15 · 55.6%  ·  Neg 11 · 40.7%  ·  Other 1 · 3.7%
Cepheid Utilization
January – June (2026)
PositiveNegativeOther
Avg 20 positive /mo
33
Jan
27
28
Feb
9
3
9
Mar
11
3
13
Apr
6
1
14
May
10
5
24
Jun
9
2
Positive121 · 58.5%
Negative72 · 34.8%
Other14 · 6.8%
Cepheid Utilization
July – December (2026) · in progress
15
Jul
11
1
Aug
Sep
Oct
Nov
Dec
Positive15 · 55.6%
Negative11 · 40.7%
Other1 · 3.7%
HepCUREConfidential — Do not copy or distribute
Section 04

DBS Utilization

Slides 13 – 15
Top
04of 12
DBS Testing
Program YTD Summary
DBS Results
Program (Team 1 + Team 2) · Jan–Jul 2026
TotalSamples772Jan–Jul 2026avg 110 total /mo
Positive
29338.0%
of 772 samples
Negative
39250.8%
of 772 samples
Pending
7910.2%
Submitted · results not yet returned
Other
81.0%
2 T1 cancelled · 4 T2 training · 1 T2 cancelled · 1 T2 N/A
Predicted from same-day Cepheid 35 of 79 program-wide pending DBS (44.3%) have a Cepheid result on the same client — combined T1 + T2 matched queue
29Predicted positive9 T1 · 20 T2
5Predicted negative1 T1 · 4 T2
45Cannot predict27 T1 no Cepheid · 17 T2 no Cepheid · 1 T2 Cepheid pending
May1 / 1100% Jun14 / 4134.1% Jul20 / 3754.1%
If Cepheid predictions applied
Projected YTD split
Positive 294 · 38.0%323 · 41.7% +29+3.7 pp
Negative 393 · 50.8%398 · 51.4% +5+0.6 pp
Pending 80 · 10.2%46 · 5.8% −34−4.4 pp
Other 9 · 1.0%9 · 1.0%
Q1 · Jan–Mar
344avg 115 /mo
Pos 158 · 45.9%  ·  Neg 183 · 53.2%  ·  Other 3 · 0.9%
Q2 · Apr–Jun
391avg 130 /mo
Pos 135 · 34.5%  ·  Neg 209 · 53.5%  ·  Pending 42 · 10.7%  ·  Other 5 · 1.3%
Q3 · Jul
37T2 only
All 37 pending · T1 not in field
DBS Utilization — Program
January – June (2026) · Team 1 + Team 2 combined
PositiveNegativePendingOther
Avg 42 positive /mo
45
Jan
47
1
55
Feb
61
1
58
Mar
75
1
51
Apr
75
1
37
May
66
1
4
47
Jun
68
41
Positive293 · 39.9%
Negative392 · 53.3%
Pending42 · 5.7%
Other8 · 1.1%
DBS Utilization — Program
July – December (2026) · Jul: Team 2 only · 37 pending
Jul
37
Aug
Sep
Oct
Nov
Dec
HepCUREConfidential — Do not copy or distribute
DBS Testing · Team 1
DBS Results
Team 1 · Jan–Jun 2026
TotalSamples514Jan–Jun 2026avg 86 total /mo
Positive
17333.7%
of 514 samples
Negative
30258.8%
of 514 samples
Pending
377.2%
Jun submissions · results not yet returned
Cancelled
20.4%
1 Feb · 1 Mar
Predicted from same-day Cepheid 10 of 37 pending DBS (27.0%) have a Cepheid result on the same client — all pending submitted in June 2026
9Predicted positive
1Predicted negative
27No Cepheid match
Jun10 / 3727.0%
If Cepheid predictions applied
Projected YTD split
Positive 174 · 33.7%183 · 35.4% +9+1.7 pp
Negative 303 · 58.8%304 · 58.9% +1+0.1 pp
Pending 38 · 7.2%28 · 5.3% −10−1.9 pp
Cancelled 2 · 0.4%2 · 0.4%
Q1 · Jan–Mar
263avg 88 /mo
Pos 91 · 34.6%  ·  Neg 170 · 64.6%  ·  Cancelled 2 · 0.8%
Q2 · Apr–Jun
251avg 84 /mo
Pos 82 · 32.7%  ·  Neg 132 · 52.6%  ·  Pending 37 · 14.7%
Q3 · Jul
not in field
Team 1 not deployed in July
DBS Utilization — Team 1
January – June (2026)
PositiveNegativePendingCancelled
Avg 29 positive /mo
15
Jan
44
28
Feb
53
1
48
Mar
73
1
39
Apr
56
21
May
53
22
Jun
23
37
Positive173 · 33.7%
Negative302 · 58.8%
Pending37 · 7.2%
Cancelled2 · 0.4%
Note   ·   All 37 Pending samples were submitted in June — results not yet returned. Team 1 was not deployed in July 2026.
HepCUREConfidential — Do not copy or distribute
DBS Testing · Team 2
DBS Results — Team 2 · Jan–Jul 2026
TotalSamples258Jan–Jul 2026avg 37 total /mo
Positive
12046.5%
of 258 samples
Negative
9034.9%
of 258 samples
Pending
4216.3%
Submitted · results not yet returned
Other
62.3%
4 training · 1 cancelled · 1 N/A
Predicted from same-day Cepheid 25 of 42 pending DBS (59.5%) have a Cepheid result on the same client — DBS outcome mirrors Cepheid
20Predicted positive
4Predicted negative
18Cannot predict17 no Cepheid · 1 Cepheid pending
May1 / 1100% Jun4 / 4100% Jul20 / 3754.1%
If Cepheid predictions applied
Projected YTD split
Positive 121 · 46.5%141 · 54.3% +20+7.8 pp
Negative 91 · 34.9%95 · 36.4% +4+1.5 pp
Pending 43 · 16.3%19 · 7.0% −24−9.3 pp
Other 7 · 2.3%7 · 2.3%
Q1 · Jan–Mar
81avg 27 /mo
Pos 67 · 82.7%  ·  Neg 13 · 16.0%  ·  Pending 0  ·  Other 1 · 1.2%
Q2 · Apr–Jun
140avg 47 /mo
Pos 53 · 37.9%  ·  Neg 77 · 55.0%  ·  Pending 5 · 3.6%  ·  Other 5 · 3.6%
Q3 · Jul
37avg 37 /mo
All 37 pending · 20 have Cepheid record (Pos 15 · Neg 4 · Pending 1)
DBS Utilization
January – June (2026)
PositiveNegativePendingOther
Avg 20 positive /mo
30
Jan
3
1
27
Feb
8
10
Mar
2
12
Apr
19
1
16
May
13
1
4
25
Jun
45
4
Positive120 · 54.3%
Negative90 · 40.7%
Pending5 · 2.3%
Other6 · 2.7%
DBS Utilization
July – December (2026) · Jul: 37 pending
Jul
37
Aug
Sep
Oct
Nov
Dec
Positive0 · 0.0%
Negative0 · 0.0%
Pending37 · 100%
Other0 · 0.0%
HepCUREConfidential — Do not copy or distribute
Section 05

POCT Utilization

Slides 16 – 18
Top
05of 12
Point-of-Care Testing
Program YTD Summary
HCV Antibody Assessments (POCT)
Program (Team 1 + Team 2) · Jan–Jul 2026
Total POCTAssessments1,680Jan–Jul 2026avg 240 total /mo
HCV Antibody Positive (Ab+)
22813.6%
Reactive POCT — RNA confirmation required
HCV Antibody Negative (Ab−)
1,45286.4%
Non-reactive POCT
Q1 · Jan–Mar
810avg 270 /mo
Ab+ 92 · 11.4%  ·  Ab− 718 · 88.6%
Q2 · Apr–Jun
811avg 270 /mo
Ab+ 128 · 15.8%  ·  Ab− 683 · 84.2%
Q3 · Jul
59T2 only · T1 not in field
Ab+ 8 · 13.6%  ·  Ab− 51 · 86.4%
POCT Antibody Assessments — Program
January – June (2026) · Team 1 + Team 2 combined
Ab+ (Reactive)Ab− (Non-Reactive)
Avg 32 Ab+ /mo
12.1%
29
Jan
211
9.3%
20
Feb
194
12.1%
43
Mar
313
20.1%
54
Apr
215
12.9%
27
May
182
14.1%
47
Jun
286
Ab+ Reactive220 · 13.6%
Ab− Non-Reactive1,401 · 86.4%
Jan–Jun Total1,621
Note   ·   POCT = HCV antibody screening (Ab+ / Ab−). A reactive (Ab+) result indicates prior HCV exposure and requires confirmatory RNA testing (Cepheid) to determine active infection. Program-wide positivity rate is 13.6% — see individual team slides for site-level trends.
POCT Antibody Assessments — Program
July – December (2026) · Jul: Team 2 only (T1 not in field) · Aug–Dec no data
Ab+ (Reactive)Ab− (Non-Reactive)
13.6%
8
Jul
51
Aug
Sep
Oct
Nov
Dec
Ab+ Reactive8 · 13.6%
Ab− Non-Reactive51 · 86.4%
Jul Total59
HepCUREConfidential — Do not copy or distribute
Point-of-Care Testing · Team 1
HCV Antibody Assessments (POCT)
Team 1 · Jan–Jun 2026
Total POCTAssessments1,217Jan–Jun 2026avg 203 total /mo
HCV Antibody Positive (Ab+)
17114.1%
Reactive POCT — RNA confirmation required
HCV Antibody Negative (Ab−)
1,04685.9%
Non-reactive POCT · includes +8 retested later
Q1 · Jan–Mar
640avg 213 /mo
Ab+ 70 · 10.9%  ·  Ab− 570 · 89.1%
Q2 · Apr–Jun
577avg 192 /mo
Ab+ 101 · 17.5%  ·  Ab− 476 · 82.5%
Q3 · Jul
no data
Jul-Dec data not yet available
POCT Antibody Assessments
January – June (2026)
Ab+ (Reactive)Ab− (Non-Reactive)
Avg 29 Ab+ /mo
12.1%
17
Jan
124
8.9%
15
Feb
153
11.5%
38
Mar
293
20.1%
47
Apr
187
15.3%
22
May
122
16.1%
32
Jun
167
Ab+ Reactive171 · 14.1%
Ab− Non-Reactive1,046 · 85.9%
Total POCT1,217
Note   ·   POCT = HCV antibody screening (Ab+ / Ab−). A reactive (Ab+) result indicates prior HCV exposure and requires confirmatory RNA testing to determine active infection. Ab− totals include +8 clients re-tested in a later month — counts reflect the final confirmed POCT outcome.
POCT Antibody Assessments
July – December (2026) · Jul: no data found
Jul
Aug
Sep
Oct
Nov
Dec
Ab+ Reactive— · no data
Ab− Non-Reactive— · no data
Total POCT
HepCUREConfidential — Do not copy or distribute
Point-of-Care Testing · Team 2
HCV Antibody Assessments (POCT)
Team 2 · Jan–Jul 2026
Total POCTAssessments463Jan–Jul 2026avg 66 total /mo
HCV Antibody Positive (Ab+)
5712.3%
Reactive POCT — RNA confirmation required
HCV Antibody Negative (Ab−)
40687.7%
Non-reactive POCT
Q1 · Jan–Mar
170avg 57 /mo
Ab+ 22 · 12.9%  ·  Ab− 148 · 87.1%
Q2 · Apr–Jun
234avg 78 /mo
Ab+ 27 · 11.5%  ·  Ab− 207 · 88.5%
Q3 · Jul
59Jul only
Ab+ 8 · 13.6%  ·  Ab− 51 · 86.4%
POCT Antibody Assessments
January – June (2026)
Ab+ (Reactive)Ab− (Non-Reactive)
Avg 8 Ab+ /mo
12.1%
12
Jan
87
10.9%
5
Feb
41
20.0%
5
Mar
20
20.0%
7
Apr
28
7.7%
5
May
60
11.2%
15
Jun
119
Ab+ Reactive49 · 12.1%
Ab− Non-Reactive355 · 87.9%
Jan–Jun Total404
Note   ·   POCT = HCV antibody screening (Ab+ / Ab−). A reactive (Ab+) result indicates prior HCV exposure and requires confirmatory RNA testing to determine active infection.
POCT Antibody Assessments
July – December (2026) · Jul actuals · Aug–Dec no data
Ab+ (Reactive)Ab− (Non-Reactive)
13.6%
8
Jul
51
Aug
Sep
Oct
Nov
Dec
Ab+ Reactive8 · 13.6%
Ab− Non-Reactive51 · 86.4%
Jul Total59
HepCUREConfidential — Do not copy or distribute
Section 06

POCT Utilization (HIV)

Slides 19 – 21
Top
06of 12
HIV Point-of-Care Testing
Program YTD Summary
HIV Antibody Assessments (POCT)
Program (Team 1 + Team 2) · Jan–Jul 2026
Total HIVAssessments490Jan–Jul 2026avg 70 total /mo
HIV Antibody Positive (Ab+)
51.0%
Reactive POCT — confirmatory testing required
HIV Antibody Negative (Ab−)
48599.0%
Non-reactive POCT
Q1 · Jan–Mar
174avg 58 /mo
Ab+ 4 · 2.3%  ·  Ab− 170 · 97.7%
Q2 · Apr–Jun
259avg 86 /mo
Ab+ 1 · 0.4%  ·  Ab− 258 · 99.6%
Q3 · Jul
57T2 only · T1 not in field
Ab+ 0  ·  Ab− 57 · 100%
HIV POCT Assessments — Program
January – June (2026) · Team 1 + Team 2 combined
Ab+ (Reactive)Ab− (Non-Reactive)
Avg 1 Ab+ /mo
3.1%
3
Jan
93
2.0%
1
Feb
48
0%
Mar
29
0%
Apr
32
1.5%
1
May
64
0%
Jun
162
Ab+ Reactive5 · 1.2%
Ab− Non-Reactive428 · 98.8%
Jan–Jun Total433
Note   ·   HIV POCT = HIV antibody screening (Ab+ / Ab−). Program-wide positivity rate is only 1.0% (5 reactive of 490). Team 1 was not routinely offering HIV testing until June 2026 — see team slides for site-level context.
HIV POCT Assessments — Program
July – December (2026) · Jul: Team 2 only · Aug–Dec no data
Ab+ (Reactive)Ab− (Non-Reactive)
0%
Jul
57
Aug
Sep
Oct
Nov
Dec
Ab+ Reactive0 · 0.0%
Ab− Non-Reactive57 · 100%
Jul Total57
HepCUREConfidential — Do not copy or distribute
HIV Point-of-Care Testing · Team 1
HIV Antibody Assessments (POCT)
Team 1 · Jan–Jun 2026
Total HIVAssessments34Jan–Jun 2026avg 6 total /mo
Programmatic Note · June 2026 Launch HIV POCT was not a routine offering for Team 1 through most of H1 2026 — only 7 assessments were completed across Jan–May (1 · 3 · 2 · 0 · 1). June 2026 marks the operational launch, with 27 assessments in a single month — a 27× jump reflecting the team formally adding HIV screening to the outreach workflow.
HIV Antibody Positive (Ab+)
00.0%
No reactive results this period
HIV Antibody Negative (Ab−)
34100%
All non-reactive
Q1 · Jan–Mar
6avg 2 /mo
Ab+ 0  ·  Ab− 6 · 100%
Q2 · Apr–Jun
28Apr 0 · May 1 · Jun 27
Ab+ 0  ·  Ab− 28 · 100%
Q3 · Jul
not in field
No July data reported
HIV POCT Assessments — Team 1
January – June (2026) · Launch month: June
Ab+ (Reactive)Ab− (Non-Reactive)
0 Ab+ this period
0%
Jan
1
0%
Feb
3
0%
Mar
2
Apr
0%
May
1
0%
Jun
27
Ab+ Reactive0 · 0.0%
Ab− Non-Reactive35 · 100%
Jan–Jun Total34
HepCUREConfidential — Do not copy or distribute
HIV Point-of-Care Testing · Team 2
HIV Antibody Assessments (POCT)
Team 2 · Jan–Jul 2026
Total HIVAssessments456Jan–Jul 2026avg 65 total /mo
HIV Antibody Positive (Ab+)
51.1%
Reactive POCT — confirmatory testing required
HIV Antibody Negative (Ab−)
45198.9%
Non-reactive POCT
Q1 · Jan–Mar
168avg 56 /mo
Ab+ 4 · 2.4%  ·  Ab− 164 · 97.6%
Q2 · Apr–Jun
231avg 77 /mo
Ab+ 1 · 0.4%  ·  Ab− 230 · 99.6%
Q3 · Jul
57Jul only
Ab+ 0  ·  Ab− 57 · 100%
HIV POCT Assessments — Team 2
January – June (2026)
Ab+ (Reactive)Ab− (Non-Reactive)
Avg 1 Ab+ /mo
3.2%
3
Jan
92
2.2%
1
Feb
45
0%
Mar
27
0%
Apr
32
1.6%
1
May
63
0%
Jun
135
Ab+ Reactive5 · 1.3%
Ab− Non-Reactive394 · 98.7%
Jan–Jun Total399
HIV POCT Assessments — Team 2
July – December (2026) · Jul actuals · Aug–Dec no data
Ab+ (Reactive)Ab− (Non-Reactive)
0%
Jul
57
Aug
Sep
Oct
Nov
Dec
Ab+ Reactive0 · 0.0%
Ab− Non-Reactive57 · 100%
Jul Total57
HepCUREConfidential — Do not copy or distribute
Section 07

Outreach Statistics · Team 1

Slides 22 – 30
Top
07of 12
Team Performance · Year-to-Date 2026
Registrations by Disposition Group
January – July 2026Team 1 · YTD merged disposition scorecard
1,773 total registrations
Case management
current as of
July 17, 2026
Ab+701 · 39.5%
Ab−1,072 · 60.5%
Group 1POCT Negative1,072 · 60.5%
  • POCT Incomplete34
  • POCT Neg1,038
Group 2RNA Positive223 · 12.6%
  • Active106
  • Active-Bridge31
  • Active-Lost21
  • Completed6
  • Consult Req9
  • Cured1
  • Delivery1
  • External Tx7
  • HIV Patient2
  • Jail1
  • Missing Drug1
  • Missing RNA15
  • No Coverage1
  • No OHIP2
  • Not Ready4
  • Refused Tx4
  • Rx1
  • SOT4
  • Trillium1
  • Unable to Tx5
Group 3RNA Negative465 · 26.2%
  • Previously Tx297
  • Self-Cured168
Group 4RNA Pending2 · 0.1%
  • BW RLTS2
Group 5RNA Required11 · 0.6%
  • BW Req1
  • Cepheid3
  • Lab Req2
  • Refused BW2
  • Resistance3
YTD basis: Aggregated across the six monthly disposition scorecards Jan–Jun 2026. July recorded no field activity for Team 1. Percentages calculated against the 1,773-client total.
HepCUREConfidential — Do not copy or distribute
Team Performance · Year-to-Date 2026
Linked to Care · Performance Scorecard
January – July 2026Team 1 · RNA-positive care pathway
223 positive clients
Case management
current as of
July 17, 2026
Care Pathway · H1 2026 (Jan–Jun) LinkedIn ProgUnableLost
Avg 30 /mo
15
Jan
1
1
36
Feb
1
2
4
45
Mar
1
3
36
Apr
5
2
1
19
May
3
4
4
27
Jun
2
8
3
Linked178 · 79.8%
In Prog11 · 4.9%
Unable18 · 8.1%
Lost16 · 7.2%
Care Pathway · H2 2026 (Jul–Dec)
Jul: not in field
Jul
Aug
Sep
Oct
Nov
Dec
Linked0 · —%
In Prog0 · —%
Unable0 · —%
Lost0 · —%
Group ALinked to Care178 · 79.8%
  • Active106
  • Active-Bridge31
  • Active-Lost21
  • Completed6
  • Cured1
  • Delivery1
  • External Tx7
  • Rx1
  • SOT4
Group BIn Progress11 · 4.9%
  • Consult Req9
  • Missing Drug1
  • Trillium1
Group CUnable to Tx18 · 8.1%
  • HIV Patient2
  • No Coverage1
  • No OHIP2
  • Not Ready4
  • Refused Tx4
  • Unable to Tx5
Group DLost to Follow Up16 · 7.2%
  • Jail1
  • Missing RNA15
Care-pathway basis: Each RNA-positive disposition mapped into Linked / In Progress / Unable / Lost per the standard HepCURE case-management framework. Percentages calculated against the 223 RNA-positive clients captured Jan–Jun 2026 (Team 1 was not in the field in July).
HepCUREConfidential — Do not copy or distribute
Team Performance · Q1 2026
Registrations by Disposition Group
January 2026Team 1 · monthly disposition scorecard
193 total registrations
Ab+79 · 35.8%
Ab−134 · 64.2%
Group 1POCT Negative124 · 64.2%
  • POCT Neg124
Group 2RNA Positive17 · 8.8%
  • Active9
  • Active-Lost3
  • Completed2
  • Cured1
  • Missing RNA1
  • No Coverage1
Group 3RNA Negative52 · 26.9%
  • Previously Tx38
  • Self-Cured14
Group 4RNA Pending0 · 0.0%
  • No entries this month
Group 5RNA Required0 · 0.0%
  • No entries this month
HepCUREConfidential — Do not copy or distribute
Team Performance · Q1 2026
Registrations by Disposition Group
February 2026Team 1 · monthly disposition scorecard
278 total registrations
Ab+125 · 45.0%
Ab−153 · 55.0%
Group 1POCT Negative153 · 55.0%
  • POCT Neg153
Group 2RNA Positive43 · 15.5%
  • Active29
  • Active-Lost4
  • Consult Req1
  • External Tx3
  • Missing RNA4
  • Not Ready2
Group 3RNA Negative80 · 28.8%
  • Previously Tx60
  • Self-Cured20
Group 4RNA Pending0 · 0.0%
  • No entries this month
Group 5RNA Required2 · 0.7%
  • Lab Req1
  • Resistance1
HepCUREConfidential — Do not copy or distribute
Team Performance · Q1 2026
Registrations by Disposition Group
March 2026Team 1 · monthly disposition scorecard
457 total registrations
Ab+159 · 34.8%
Ab−298 · 65.2%
Group 1POCT Negative298 · 65.2%
  • POCT Incomplete6
  • POCT Neg292
Group 2RNA Positive49 · 10.7%
  • Active29
  • Active-Bridge1
  • Active-Lost9
  • Completed3
  • External Tx3
  • Jail1
  • Missing RNA2
  • Refused Tx1
Group 3RNA Negative106 · 23.2%
  • Previously Tx72
  • Self-Cured34
Group 4RNA Pending0 · 0.0%
  • No entries this month
Group 5RNA Required4 · 0.9%
  • BW Req1
  • Lab Req1
  • Resistance2
HepCUREConfidential — Do not copy or distribute
Team Performance · Q2 2026
Registrations by Disposition Group
April 2026Team 1 · monthly disposition scorecard
340 total registrations
Ab+139 · 40.9%
Ab−201 · 59.1%
Group 1POCT Negative201 · 59.1%
  • POCT Incomplete15
  • POCT Neg186
Group 2RNA Positive44 · 12.9%
  • Active23
  • Active-Bridge3
  • Active-Lost4
  • Completed1
  • Consult Req5
  • Delivery1
  • Missing RNA1
  • Refused Tx1
  • SOT4
  • Unable to Tx1
Group 3RNA Negative90 · 26.5%
  • Previously Tx47
  • Self-Cured43
Group 4RNA Pending0 · 0.0%
  • No entries this month
Group 5RNA Required5 · 1.5%
  • Cepheid3
  • Refused BW2
HepCUREConfidential — Do not copy or distribute
Team Performance · Q2 2026
Registrations by Disposition Group
May 2026Team 1 · monthly disposition scorecard
223 total registrations
Ab+99 · 44.4%
Ab−124 · 55.6%
Group 1POCT Negative124 · 55.6%
  • POCT Incomplete3
  • POCT Neg121
Group 2RNA Positive30 · 13.5%
  • Active16
  • Active-Bridge2
  • Consult Req2
  • External Tx1
  • HIV Patient1
  • Missing Drug1
  • Missing RNA4
  • No OHIP1
  • Not Ready2
Group 3RNA Negative69 · 30.9%
  • Previously Tx43
  • Self-Cured26
Group 4RNA Pending0 · 0.0%
  • No entries this month
Group 5RNA Required0 · 0.0%
  • No entries this month
Data note: The Delivery disposition previously reported for May has been removed and the Active count updated to 16 in the reconciled dataset.
HepCUREConfidential — Do not copy or distribute
Team Performance · Q2 2026
Registrations by Disposition Group
June 2026Team 1 · monthly disposition scorecard
282 total registrations
Ab+110 · 39.0%
Ab−172 · 61.0%
Group 1POCT Negative172 · 61.0%
  • POCT Incomplete10
  • POCT Neg162
Group 2RNA Positive40 · 14.2%
  • Active-Bridge25
  • Active-Lost1
  • Consult Req1
  • HIV Patient1
  • Missing RNA3
  • No OHIP1
  • Refused Tx2
  • Rx1
  • Trillium1
  • Unable to Tx4
Group 3RNA Negative68 · 24.1%
  • Previously Tx37
  • Self-Cured31
Group 4RNA Pending2 · 0.7%
  • BW RLTS2
Group 5RNA Required0 · 0.0%
  • No entries this month
HepCUREConfidential — Do not copy or distribute
Team Performance · Q3 2026
Registrations by Disposition Group
July 2026Team 1 · monthly disposition scorecard
0 total registrations
Team 1 · Field Activity
Not in Field
July 2026 · No registrations recorded this month
Operational note: Team 1 was not deployed in the field during July 2026. As a result, no client registrations, POCT screens or downstream dispositions are captured for this reporting period. Regular outreach schedule is planned to resume in August 2026 — figures will populate the standard four-group framework once activity restarts.
HepCUREConfidential — Do not copy or distribute
Section 08

Outreach Statistics · Team 2

Slides 31 – 39
Top
08of 12
Team Performance · Year-to-Date 2026
Registrations by Disposition Group
January – July 2026Team 2 · YTD merged disposition scorecard
817 total registrations
Case management
current as of
July 17, 2026
Ab+407 · 49.8%
Ab−410 · 50.2%
Group 1POCT Negative410 · 50.2%
  • POCT Neg410
Group 2RNA Positive192 · 23.5%
  • Active77
  • Active-3 Weeks2
  • Active-Bridge40
  • Active-Lost8
  • Ambassador4
  • Compassionate1
  • Completed21
  • Consult Req6
  • Cured10
  • Delivery5
  • External Tx2
  • Manual Claim2
  • Not Ready3
  • Trillium1
  • Unable to Tx4
  • Missing RNA3
  • Cepheid1
  • HIV Patient1
  • NIHB1
Group 3RNA Negative186 · 22.8%
  • Previously Tx102
  • Self-Cured84
Group 4RNA Pending20 · 2.4%
  • BW RLTS20
Group 5RNA Required9 · 1.1%
  • Lab Req7
  • Resistance1
  • BW Req1
YTD basis: Authoritative Team 2 dataset · Jan 206 · Feb 96 · Mar 50 · Apr 67 · May 107 · Jun 190 · Jul 101 = 817 total. Monthly disposition slides (Slides 32–38) reflect this same source dataset. Program-wide roll-up on Slide 3 combines this with Team 1's 1,773 for a program total of 2,590.
HepCUREConfidential — Do not copy or distribute
Team Performance · Year-to-Date 2026
Linked to Care · Performance Scorecard
January – July 2026Team 2 · RNA-positive care pathway
185 positive clients
Case management
current as of
July 17, 2026
Care Pathway · H1 2026 (Jan–Jun) LinkedIn ProgUnableLost
Avg 27 /mo
43
Jan
1
1
36
Feb
1
1
15
Mar
18
Apr
2
25
May
25
Jun
2
2
2
Linked172 · 93.1%
Unable7 · 3.4%
In Prog3 · 1.7%
Lost3 · 1.7%
Care Pathway · H2 2026 (Jul–Dec)
in progress
10
Jul
1
Aug
Sep
Oct
Nov
Dec
Linked11 · 90.9%
Unable1 · 9.1%
In Prog0 · 0.0%
Lost0 · 0.0%
Group ALinked to Care172 · 93.0%
  • Active103
  • Active-3 Weeks2
  • Active-Bridge15
  • Active-Lost8
  • Ambassador3
  • Compassionate1
  • Completed20
  • Cured11
  • Delivery5
  • External Tx2
  • Manual Claim2
Group BIn Progress3 · 1.6%
  • Consult Req2
  • Trillium1
Group CUnable to Tx7 · 3.8%
  • Not Ready3
  • Unable to Tx4
Group DLost to Follow Up3 · 1.6%
  • Missing RNA3
Care-pathway basis: Aggregated from the 185 RNA-positive Team 2 clients across Jan–Jul 2026. Percentages reflect share of the RNA-positive cohort (denominator = 185).
HepCUREConfidential — Do not copy or distribute
Team Performance · Q1 2026
Registrations by Disposition Group
January 2026Team 2 · monthly disposition scorecard
206 total registrations
Case management
current as of
July 17, 2026
Ab+118 · 52.4%
Ab−108 · 47.6%
Group 1POCT Negative98 · 47.6%
  • Negative98
Group 2RNA Positive45 · 21.8%
  • Active25
  • Active-Lost5
  • Ambassador1
  • Completed7
  • Cured4
  • External Tx1
  • Missing RNA1
  • Not Ready1
Group 3RNA Negative61 · 29.6%
  • Previously Tx41
  • Self-Cured20
Group 4RNA Pending0 · 0.0%
  • No entries this month
Group 5RNA Required2 · 1.0%
  • Lab Req2
HepCUREConfidential — Do not copy or distribute
Team Performance · Q1 2026
Registrations by Disposition Group
February 2026Team 2 · monthly disposition scorecard
96 total registrations
Case management
current as of
July 17, 2026
Ab+63 · 55.2%
Ab−53 · 44.8%
Group 1POCT Negative43 · 44.8%
  • Negative43
Group 2RNA Positive38 · 39.6%
  • Active18
  • Active-Bridge1
  • Active-Lost2
  • Ambassador1
  • Completed8
  • Consult Req1
  • Cured4
  • Delivery1
  • External Tx1
  • Unable to Tx1
Group 3RNA Negative13 · 13.5%
  • Previously Tx9
  • Self-Cured4
Group 4RNA Pending0 · 0.0%
  • No entries this month
Group 5RNA Required2 · 2.1%
  • Lab Req2
HepCUREConfidential — Do not copy or distribute
Team Performance · Q1 2026
Registrations by Disposition Group
March 2026Team 2 · monthly disposition scorecard
50 total registrations
Case management
current as of
July 17, 2026
Ab+39 · 60.0%
Ab−21 · 40.0%
Group 1POCT Negative20 · 40.0%
  • Negative20
Group 2RNA Positive15 · 30.0%
  • Active9
  • Active-Lost1
  • Completed4
  • Cured1
Group 3RNA Negative14 · 28.0%
  • Previously Tx3
  • Self-Cured11
Group 4RNA Pending0 · 0.0%
  • No entries this month
Group 5RNA Required1 · 2.0%
  • Lab Req1
HepCUREConfidential — Do not copy or distribute
Team Performance · Q2 2026
Registrations by Disposition Group
April 2026Team 2 · monthly disposition scorecard
67 total registrations
Case management
current as of
July 17, 2026
Ab+52 · 62.7%
Ab−33 · 37.3%
Group 1POCT Negative25 · 37.3%
  • Negative25
Group 2RNA Positive20 · 29.9%
  • Active14
  • Ambassador1
  • Completed1
  • Cured1
  • Delivery1
  • Not Ready1
  • Unable to Tx1
Group 3RNA Negative21 · 31.3%
  • Previously Tx12
  • Self-Cured9
Group 4RNA Pending0 · 0.0%
  • No entries this month
Group 5RNA Required1 · 1.5%
  • Resistance1
HepCUREConfidential — Do not copy or distribute
Team Performance · Q2 2026
Registrations by Disposition Group
May 2026Team 2 · monthly disposition scorecard
107 total registrations
Case management
current as of
July 17, 2026
Ab+58 · 44.9%
Ab−69 · 55.1%
Group 1POCT Negative59 · 55.1%
  • Negative59
Group 2RNA Positive25 · 23.4%
  • Active12
  • Active-Bridge6
  • Compassionate1
  • Cured1
  • Delivery3
  • Manual Claim2
Group 3RNA Negative22 · 20.6%
  • Previously Tx16
  • Self-Cured6
Group 4RNA Pending0 · 0.0%
  • No entries this month
Group 5RNA Required1 · 0.9%
  • Lab Req1
HepCUREConfidential — Do not copy or distribute
Team Performance · Q2 2026
Registrations by Disposition Group
June 2026Team 2 · monthly disposition scorecard
190 total registrations
Case management
current as of
June 17, 2026
Ab+86 · 40.0%
Ab−124 · 60.0%
Group 1POCT Negative114 · 60.0%
  • Negative114
Group 2RNA Positive31 · 16.3%
  • Active25
  • Consult Req1
  • Missing RNA2
  • Not Ready1
  • Trillium1
  • Unable to Tx1
Group 3RNA Negative42 · 22.1%
  • Previously Tx19
  • Self-Cured23
Group 4RNA Pending2 · 1.1%
  • BW RLTS2
Group 5RNA Required1 · 0.5%
  • Lab Req1
HepCUREConfidential — Do not copy or distribute
Team Performance · Q3 2026
Registrations by Disposition Group
July 2026Team 2 · monthly disposition scorecard
83 total registrations
Case management
current as of
July 17, 2026
Ab+52 · 50.6%
Ab−51 · 49.4%
Group 1POCT Negative41 · 49.4%
  • Negative41
Group 2RNA Positive14 · 16.9%
  • Active-3 Weeks2
  • Active-Bridge7
  • Ambassador1
  • Consult Req1
  • HIV Patient1
  • Pending1
  • Unable to Tx1
Group 3RNA Negative11 · 13.3%
  • Previously Tx1
  • Self-Cured10
Group 4RNA Pending17 · 20.5%
  • BW RLTS17
Group 5RNA Required0 · 0.0%
  • No entries this month
HepCUREConfidential — Do not copy or distribute
Section 09

Clinical Assessments
Team 1

Slides 40 – 46
Top
09of 12
Team 1 Performance
Year-to-Date 2026
Clinical Assessments
Team 1 · Jan–Jun
Year-to-DateTeam 1 · Jan–Jun 2026
2,040 total assessments
Group 1HCV · POCT1217 · 59.7%
  • Neg1046
  • Pos171
Group 2HIV · POCT34 · 1.7%
  • Neg34
Group 3Cepheid275 · 13.5%
  • Error5
  • Neg101
  • Pos169
Group 4DBS514 · 25.2%
  • Cancelled2
  • Neg302
  • Pending37
  • Pos173
Reporting basis: Roll-up of Team 1's monthly clinical assessments Jan–Jun 2026. Assessments are counted by the month they are completed. Individual monthly breakdowns appear on the following six slides.
HepCUREConfidential — Do not copy or distribute
Team Performance · Q1 2026
Clinical Assessments Completed
January 2026Team 1 · monthly clinical assessments
223 total assessments
Group 1HCV · POCT141 · 63.2%
  • Neg124
  • Pos17
Group 2HIV · POCT1 · 0.4%
  • Neg1
Group 3Cepheid22 · 9.9%
  • Error1
  • Neg8
  • Pos13
Group 4DBS59 · 26.5%
  • Neg44
  • Pos15
BW RLTS Pending · Cepheid Breakdown (of 1 pending)
With Cepheid
Result available0
↳ Of the 0 with Cepheid result
Positive0
Negative0
Without Cepheid
Result unavailable1
Reporting basis: Clinical assessments are counted by the month they are completed, not by the client's original registration month. A client registered in an earlier month whose assessment is finalized within the reporting period is included in that period's total — giving a true monthly workload view rather than a cohort view.
HepCUREConfidential — Do not copy or distribute
Team Performance · Q1 2026
Clinical Assessments Completed
February 2026Team 1 · monthly clinical assessments
300 total assessments
Group 1HCV · POCT168 · 56.0%
  • Neg153
  • Pos15
Group 2HIV · POCT3 · 1.0%
  • Neg3
Group 3Cepheid47 · 15.7%
  • Error2
  • Neg19
  • Pos26
Group 4DBS82 · 27.3%
  • Cancelled1
  • Neg53
  • Pos28
BW RLTS Pending · Cepheid Breakdown (of 6 pending)
With Cepheid
Result available2
↳ Of the 2 with Cepheid result
Positive1
Negative1
Without Cepheid
Result unavailable4
Reporting basis: Clinical assessments are counted by the month they are completed, not by the client's original registration month. A client registered in an earlier month whose assessment is finalized within the reporting period is included in that period's total — giving a true monthly workload view rather than a cohort view.
HepCUREConfidential — Do not copy or distribute
Team Performance · Q1 2026
Clinical Assessments Completed
March 2026Team 1 · monthly clinical assessments
521 total assessments
Group 1HCV · POCT331 · 63.5%
  • Neg293
  • Pos38
Group 2HIV · POCT2 · 0.4%
  • Neg2
Group 3Cepheid66 · 12.7%
  • Error1
  • Neg23
  • Pos42
Group 4DBS122 · 23.4%
  • Cancelled1
  • Neg73
  • Pos48
BW RLTS Pending · Cepheid Breakdown (of 23 pending)
With Cepheid
Result available14
↳ Of the 14 with Cepheid result
Positive13
Negative1
Without Cepheid
Result unavailable9
Reporting basis: Clinical assessments are counted by the month they are completed, not by the client's original registration month. A client registered in an earlier month whose assessment is finalized within the reporting period is included in that period's total — giving a true monthly workload view rather than a cohort view.
HepCUREConfidential — Do not copy or distribute
Team Performance · Q2 2026
Clinical Assessments Completed
April 2026Team 1 · monthly clinical assessments
388 total assessments
Group 1HCV · POCT234 · 60.3%
  • Neg187
  • Pos47
Group 2HIV · POCT0 · 0.0%
  • No data
Group 3Cepheid59 · 15.2%
  • Neg25
  • Pos34
Group 4DBS95 · 24.5%
  • Neg56
  • Pos39
BW RLTS Pending · Cepheid Breakdown (of 9 pending)
With Cepheid
Result available4
↳ Of the 4 with Cepheid result
Positive4
Negative0
Without Cepheid
Result unavailable5
Reporting basis: Clinical assessments are counted by the month they are completed, not by the client's original registration month. A client registered in an earlier month whose assessment is finalized within the reporting period is included in that period's total — giving a true monthly workload view rather than a cohort view.
HepCUREConfidential — Do not copy or distribute
Team Performance · Q2 2026
Clinical Assessments Completed
May 2026Team 1 · monthly clinical assessments
250 total assessments
Group 1HCV · POCT144 · 57.6%
  • Neg122
  • Pos22
Group 2HIV · POCT1 · 0.4%
  • Neg1
Group 3Cepheid31 · 12.4%
  • Error1
  • Neg8
  • Pos22
Group 4DBS74 · 29.6%
  • Neg53
  • Pos21
Reporting basis: Clinical assessments are counted by the month they are completed, not by the client's original registration month. A client registered in an earlier month whose assessment is finalized within the reporting period is included in that period's total — giving a true monthly workload view rather than a cohort view.
HepCUREConfidential — Do not copy or distribute
Team Performance · Q2 2026
Clinical Assessments Completed
June 2026Team 1 · monthly clinical assessments
358 total assessments
Group 1HCV · POCT199 · 55.6%
  • Neg167
  • Pos32
Group 2HIV · POCT27 · 7.5%
  • Neg27
Group 3Cepheid50 · 14.0%
  • Neg18
  • Pos32
Group 4DBS82 · 22.9%
  • Neg23
  • Pending37
  • Pos22
BW RLTS Pending · Cepheid Breakdown (of 35 pending)
With Cepheid
Result available7
↳ Of the 7 with Cepheid result
Positive7
Negative0
Without Cepheid
Result unavailable28
Reporting basis: Clinical assessments are counted by the month they are completed, not by the client's original registration month. A client registered in an earlier month whose assessment is finalized within the reporting period is included in that period's total — giving a true monthly workload view rather than a cohort view.
HepCUREConfidential — Do not copy or distribute
Section 10

Clinical Assessments
Team 2

Slides 47 – 53
Top
10of 12
Team 2 Performance
Year-to-Date 2026
Clinical Assessments
Team 2 · Jan–Jun
Year-to-DateTeam 2 · Jan–Jun 2026
1,231 total assessments
Group 1HCV · POCT404 · 32.8%
  • Neg355
  • Pos49
Group 2HIV · POCT399 · 32.4%
  • Neg394
  • Pos5
Group 3Cepheid207 · 16.8%
  • Error8
  • Invalid6
  • Neg72
  • Pos121
Group 4DBS221 · 18.0%
  • Cancelled1
  • Neg90
  • Other1
  • Pending5
  • Pos120
  • Training4
Reporting basis: Roll-up of Team 2's monthly clinical assessments Jan–Jun 2026. Assessments are counted by the month they are completed. Individual monthly breakdowns appear on the following six slides.
HepCUREConfidential — Do not copy or distribute
Team Performance · Q1 2026
Clinical Assessments Completed
January 2026Team 2 · monthly clinical assessments
288 total assessments
Group 1HCV · POCT99 · 34.4%
  • Neg87
  • Pos12
Group 2HIV · POCT95 · 33.0%
  • Neg92
  • Pos3
Group 3Cepheid60 · 20.8%
  • Neg27
  • Pos33
Group 4DBS34 · 11.8%
  • Neg3
  • Other1
  • Pos30
BW RLTS Pending · Cepheid Breakdown (of 11 pending)
With Cepheid
Result available4
↳ Of the 4 with Cepheid result
Positive3
Negative1
Without Cepheid
Result unavailable7
Reporting basis: Clinical assessments are counted by the month they are completed, not by the client's original registration month. A client registered in an earlier month whose assessment is finalized within the reporting period is included in that period's total — giving a true monthly workload view rather than a cohort view.
HepCUREConfidential — Do not copy or distribute
Team Performance · Q1 2026
Clinical Assessments Completed
February 2026Team 2 · monthly clinical assessments
167 total assessments
Group 1HCV · POCT46 · 27.5%
  • Neg41
  • Pos5
Group 2HIV · POCT46 · 27.5%
  • Neg45
  • Pos1
Group 3Cepheid40 · 24.0%
  • Invalid3
  • Neg9
  • Pos28
Group 4DBS35 · 21.0%
  • Neg8
  • Pos27
Reporting basis: Clinical assessments are counted by the month they are completed, not by the client's original registration month. A client registered in an earlier month whose assessment is finalized within the reporting period is included in that period's total — giving a true monthly workload view rather than a cohort view.
HepCUREConfidential — Do not copy or distribute
Team Performance · Q1 2026
Clinical Assessments Completed
March 2026Team 2 · monthly clinical assessments
87 total assessments
Group 1HCV · POCT25 · 28.7%
  • Neg20
  • Pos5
Group 2HIV · POCT27 · 31.0%
  • Neg27
Group 3Cepheid23 · 26.4%
  • Invalid3
  • Neg11
  • Pos9
Group 4DBS12 · 13.8%
  • Neg2
  • Pos10
BW RLTS Pending · Cepheid Breakdown (of 6 pending)
With Cepheid
Result available4
↳ Of the 4 with Cepheid result
Positive3
Negative1
Without Cepheid
Result unavailable2
Reporting basis: Clinical assessments are counted by the month they are completed, not by the client's original registration month. A client registered in an earlier month whose assessment is finalized within the reporting period is included in that period's total — giving a true monthly workload view rather than a cohort view.
HepCUREConfidential — Do not copy or distribute
Team Performance · Q2 2026
Clinical Assessments Completed
April 2026Team 2 · monthly clinical assessments
119 total assessments
Group 1HCV · POCT35 · 29.4%
  • Neg28
  • Pos7
Group 2HIV · POCT32 · 26.9%
  • Neg32
Group 3Cepheid20 · 16.8%
  • Error1
  • Neg6
  • Pos13
Group 4DBS32 · 26.9%
  • Cancelled1
  • Neg19
  • Pos12
BW RLTS Pending · Cepheid Breakdown (of 2 pending)
With Cepheid
Result available1
↳ Of the 1 with Cepheid result
Positive1
Negative0
Without Cepheid
Result unavailable1
Reporting basis: Clinical assessments are counted by the month they are completed, not by the client's original registration month. A client registered in an earlier month whose assessment is finalized within the reporting period is included in that period's total — giving a true monthly workload view rather than a cohort view.
HepCUREConfidential — Do not copy or distribute
Team Performance · Q2 2026
Clinical Assessments Completed
May 2026Team 2 · monthly clinical assessments
192 total assessments
Group 1HCV · POCT65 · 33.9%
  • Neg60
  • Pos5
Group 2HIV · POCT64 · 33.3%
  • Neg63
  • Pos1
Group 3Cepheid29 · 15.1%
  • Error5
  • Neg10
  • Pos14
Group 4DBS34 · 17.7%
  • Neg13
  • Pending1
  • Pos16
  • Training4
BW RLTS Pending · Cepheid Breakdown (of 2 pending)
With Cepheid
Result available2
↳ Of the 2 with Cepheid result
Pending1
Invalid1
Without Cepheid
Result unavailable0
Reporting basis: Clinical assessments are counted by the month they are completed, not by the client's original registration month. A client registered in an earlier month whose assessment is finalized within the reporting period is included in that period's total — giving a true monthly workload view rather than a cohort view.
HepCUREConfidential — Do not copy or distribute
Team Performance · Q2 2026
Clinical Assessments Completed
June 2026Team 2 · monthly clinical assessments
382 total assessments · 190 clients
Group 1HCV · POCT134 · 35.4%
  • Neg119
  • Pos15
Group 2HIV · POCT135 · 35.7%
  • Neg135
Group 3Cepheid35 · 9.3%
  • Error2
  • Neg9
  • Pos24
Group 4DBS74 · 19.6%
  • Neg45
  • Pending4
  • Pos25
BW RLTS · Corresponding Cepheid Results (of 50 BW RLTS records)
With Cepheid
Matching result24
↳ Of the 24 with Cepheid result
Positive13
Negative10
Error1
Without Cepheid
No matching result26
Reporting basis: Clinical assessments are counted by the month they are completed, not by the client's original registration month. A client registered in an earlier month whose assessment is finalized within the reporting period is included in that period's total — giving a true monthly workload view rather than a cohort view.
HepCUREConfidential — Do not copy or distribute
Section 11

SWOT Analysis

Slides 54 – 58
Top
11of 12
SWOT
Strengths
Ongoing
  • Outreach with mobile capacity
  • Engaging confirmed RNA / known positives and linking to care
New updates
  • Cepheid · targeted utilization
    Proprietary screening workflow — a triage protocol ensures Cepheid GeneXpert® cartridges are reserved for clients most likely to require confirmatory RNA testing, while appropriate cases are directed to BW RLTS testing (95%+ confidence in a negative result). This maximizes resource efficiency and avoids unnecessary cartridge use.
    On average, roughly two out of every three cartridges identify an RNA-positive client in need of treatment — cartridges are used efficiently, not wasted.
  • Rapid onboarding program
    A purpose-built training program develops an inexperienced hire into a high-functioning outreach resource within 10 days, building bench strength, reinforcing a culture of accountability, and reducing key-person dependency so service continuity is always protected.
  • Newly licensed CRM with real-time AI analytics — live visibility into key performance metrics, strengthening accountability across staffing, financials and performance, enabling prioritization of case-management activities and resulting in better treatment outcomes
    Was a threat · now resolvedPreviously a risk to the business: the former sponsor withdrew CRM access, making ongoing management very challenging. The newly licensed platform restores and upgrades this capability.
HepCUREConfidential — Do not copy or distribute
SWOT
Weaknesses
Ongoing
  • Aged mobile units — costly repairs
  • Cepheid GeneXpert® — lack of cartridges
  • Cost of Cepheid cartridges — the manufacturer will not extend any credit to smaller organizations despite multiple requests, so ordering and timing must be aligned to funding allocation, making month-to-month supply challenging to maintain
  • Additional data markers — implementation starting July 2026
    Starting July 2026Two additional data markers identified as valuable additions to the reporting cadence could not be operationalized during Q2 or Q3 2026 due to limited case-management and data-entry resourcing. Both markers will be captured beginning July 2026 and reported in every quarter thereafter — full detail on Slide 64 · July 2026 Rollout — New Data Markers.
    • Marker 1 · Prior HCV Exposure Markers — capturing whether screened clients had prior known HCV exposure (antibody status, confirmatory RNA, and previously-treated history). This variable was not recorded consistently during the operational reset over the past four to five months — a period marked by staffing transitions, extensive onboarding and re-training. Corrective action taken: updated intake form with mandatory "prior HCV exposure" fields embedded in the screening workflow; team retraining complete.
    • Marker 2 · Time to Treatment Start — capturing the interval from screening to first treatment dose (Same day / Within a few days / Within a few weeks / Within a month). Same-day workflow launched in Q2 but consistent per-client interval tracking remained a resourcing gap; will be captured for every client from Q4 2026 onward.
  • HepCURE domain — temporary loss of access
    Access restoredDuring the leadership and staffing transition earlier this year, administrative credentials to the HepCURE.ca domain were misplaced, which temporarily compromised our ability to update the website. Domain access has just recently been restored and full administrative control has been re-established, allowing us to resume regular website updates and communications.
Resolved
  • Outreach team screening 4 days/week; single-staff days per unit
    ResolvedAdditional staff added per team, increasing coverage per unit and reducing single-staff days.
  • Time of month can decrease screening numbers
    ResolvedScreening is now concentrated into 10–15 day sprints that typically run from around the 10th to the 25th of each month, with the team active roughly 50% of the calendar month. During active sprints, outreach staff work extended 10–12 hour days to maximize reach while eligible clients are most accessible. The structure deliberately steps away from the traditionally low-yield window (approximately the 25th to the 10th, around client cheque days, when fewer eligible clients are typically identified) and provides a predictable off-cycle period during which staff can decompress from the mental stress and exhaustion of an intensive workload. This cadence is an important safeguard for team wellbeing, given that outreach staff routinely support a high-acuity population living with substance use disorders and complex mental health needs, and it helps mitigate compassion fatigue while sustaining long-term staff retention and service continuity.
  • Lack of proper fleet & equipment maintenance over the past two years under previous management
    ResolvedMonthly preventative maintenance checks are now performed by an independent third party.
HepCUREConfidential — Do not copy or distribute
SWOT
Opportunities
Ongoing
  • Work with Public Health for referrals
  • Providing harm-reduction supplies
    Emerging opportunityRecent provincial funding changes have significantly reduced many community organizations' access to and ability to provide harm-reduction supplies, contributing to rising HCV transmission. This positions HepCURE to reach and engage the highest-risk individuals — many of whom are actively seeking supplies — creating a valuable screening and linkage-to-care opportunity.
New / Pending
  • Screening-protocol refinement — Team 2 yield materially outperforms Team 1
    Data-driven insightComparing Jan–Jul YTD registrations reveals a substantial variance in screening effectiveness between the two teams. Team 2 identified 192 RNA-positive clients from 817 registrations (23.5% yield), while Team 1 identified 223 RNA-positive clients from 1,773 registrations (12.6% yield) — meaning Team 2 achieved a comparable RNA-positive case count on less than half the screening volume, at nearly 1.9× the per-client yield. Program-wide average sits at 16.0% (415 / 2,590).
    Interpretation: The delta suggests Team 1's higher volume is capturing a broader, lower-acuity pool — likely including individuals whose self-reported risk factors may be influenced by participation in the client incentive program rather than genuine exposure. Team 2's tighter targeting is producing a higher-quality, higher-yield screening cohort.
    Opportunity: Adopt Team 2's screening approach program-wide — introduce more stringent at-risk eligibility criteria (verified exposure history, harm-reduction touchpoints, referral source) before enrollment, and re-align incentive-program safeguards so participation cannot inadvertently dilute the risk-based screening funnel. Expected impact: higher RNA-positive detection rate per outreach day, reduced downstream cost per identified case, and stronger utilization of Cepheid / DBS confirmatory capacity.
  • Team strengthening — a recent, necessary change in nursing personnel resolved a prolonged accountability and performance gap that had negatively affected operations for an extended period; the organization has since been restructured to improve reliability, quality of care, and consistent follow-through
  • Geographic expansion — recently launched screening in Sudbury, Sault Ste. Marie and Timmins
    Q3 targetTargeting 16 additional cities not previously screened.
  • Open to exploring collaboration with Vircan — discussions are currently underway
HepCUREConfidential — Do not copy or distribute
SWOT · Opportunities
Community Pharmacy & Website Refresh
  • Community pharmacy partnerships (daily dispense)
    Q3 2026 pilotWe are losing over 10 qualified clients per month to unstable housing / no fixed address (NFA). Partnering with community pharmacies for daily dispense presents a strong opportunity to improve treatment adherence and outcomes for this population — and, on that basis, to recover up to 10 additional clients per month who would otherwise be lost to follow-up.
    How the model works:
    • The client is provided an initial three-week supply directly by HepCURE at the point of engagement.
    • Our team then physically walks the client into a community pharmacy near where they live or spend time and completes the handoff / setup with the pharmacist in person, rather than leaving the referral to chance.
    • Ongoing supply is shipped in three-week increments, released only after two weeks of the previous supply has been dispensed. This creates a one-week delivery buffer, ensures continuity of treatment, and — critically — means no medication is wasted if a client discontinues.
    • Because supply is sent in short increments and not front-loaded into a single dispensary, clients retain the freedom to move to a different pharmacy or a different city without being locked in — a meaningful improvement over the current HCV dispensing norm, where clients are typically tied to a single pharmacy for the full treatment cycle due to high medication cost and complex billing requirements.
    • The community-pharmacy model also provides a meaningful co-benefit for the client: many community pharmacies also dispense opioid agonist therapy (OAT). Being introduced to a local pharmacy for HCV treatment creates a natural, low-barrier entry point for clients to access addiction / OAT care at the same location, supporting integrated wraparound treatment for a population that frequently needs both.
    The result is a distribution model that is client-centered, waste-averse and portable — better suited to the mobile, high-acuity population HepCURE serves, and directly aligned with harm-reduction principles.
  • Website refresh — professionalize the HepCURE brand
    In planningNow that domain access has been restored, the HepCURE website will undergo a full refresh to move it beyond its current grassroots look and feel toward a more polished, professional presence. The revamp will better reflect the scale of the program, strengthen credibility with sponsors, referral partners and prospective donors, and improve accessibility of clinical information for clients and community stakeholders.
    HepCURE website mockup — Extraordinary Care homepage
    Homepage · About
    HepCURE brand collateral — 97% effective
    Program · Impact
    HepCURE trifold — Caring is our specialty
    Team · Care Philosophy
    Sample website mockups — design direction under development
HepCUREConfidential — Do not copy or distribute
SWOT
Threats
Ongoing
  • Saturated screening sites — us and others attending often
New
  • Aging fleet — mobile units are roughly 10 years old (2015–2016)
    One vehicle had to be decommissioned in Q2 as repairs would have exceeded replacement cost, an unexpected expense of over $50,000 in the quarter. A second unit broke down at the end of May and required approximately $10,000 in repairs, which have since been completed and the unit is fully back in service. ResolvedThe decommissioned vehicle has been replaced by securing access to a new mobile unit, restoring full fleet capacity and ensuring uninterrupted outreach coverage going forward.
  • Community provider resistance — some community providers perceive our outreach as competing for their patients, leading to reported incidents of intimidation and threats toward staff, including police being contacted
  • These tensions appear driven by concerns over funding security and job stability — even as our screening continues to re-identify many HCV-positive individuals who have been lost to public-health follow-up for years
HepCUREConfidential — Do not copy or distribute
Section 12

Gilead Collaboration

Slides 59 – 64
Top
12of 12
Partnership
Gilead's Roles & Responsibilities
  • Campaign collateral
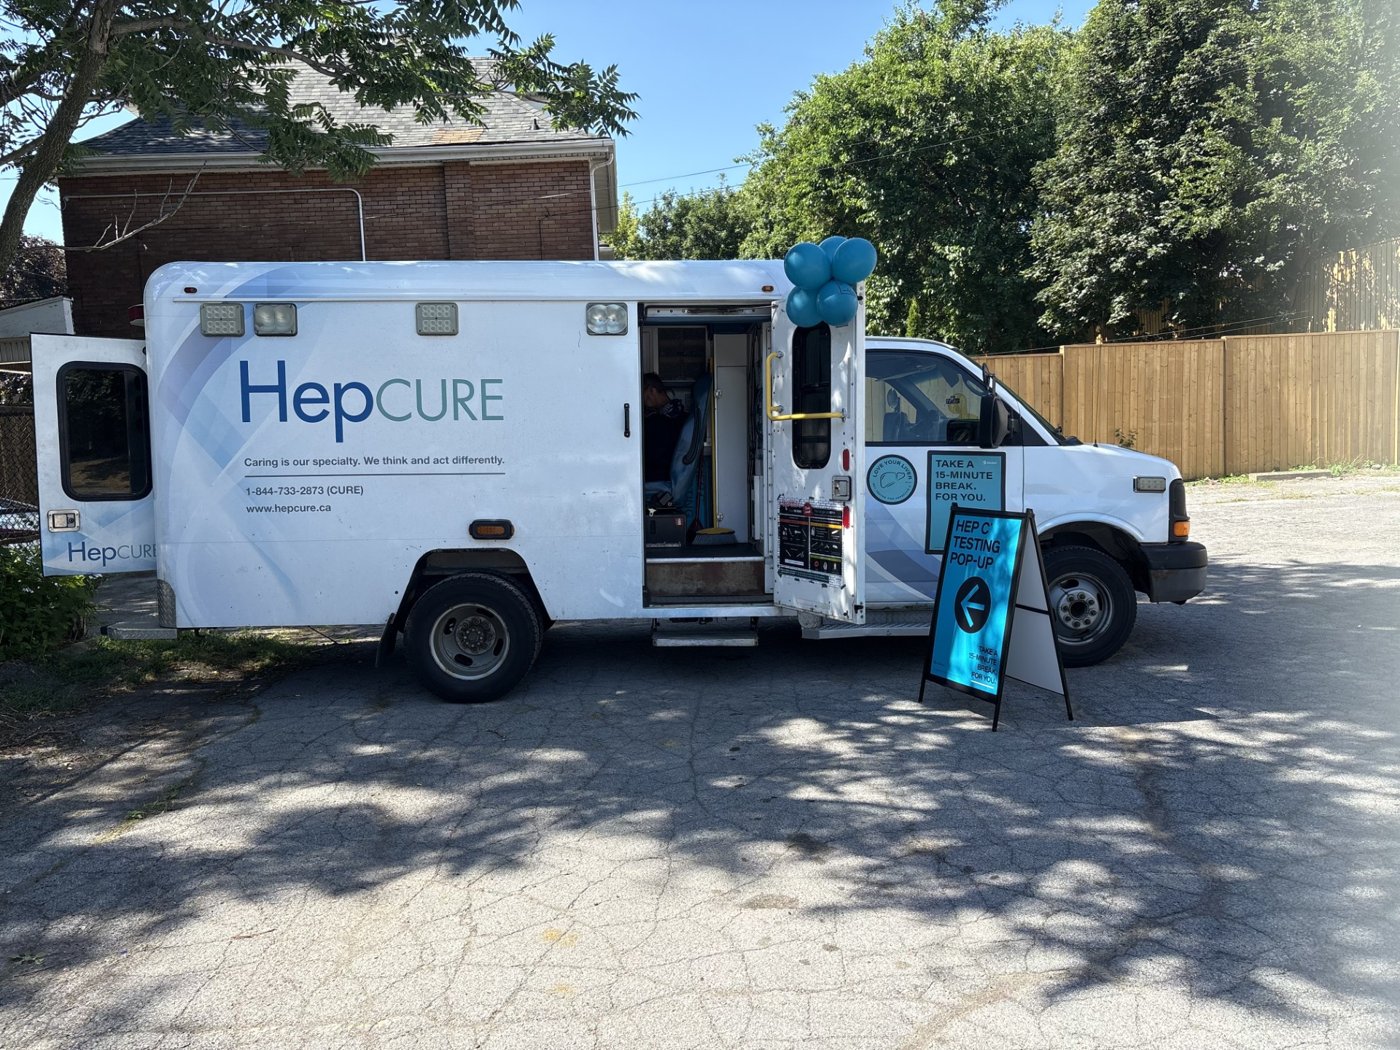
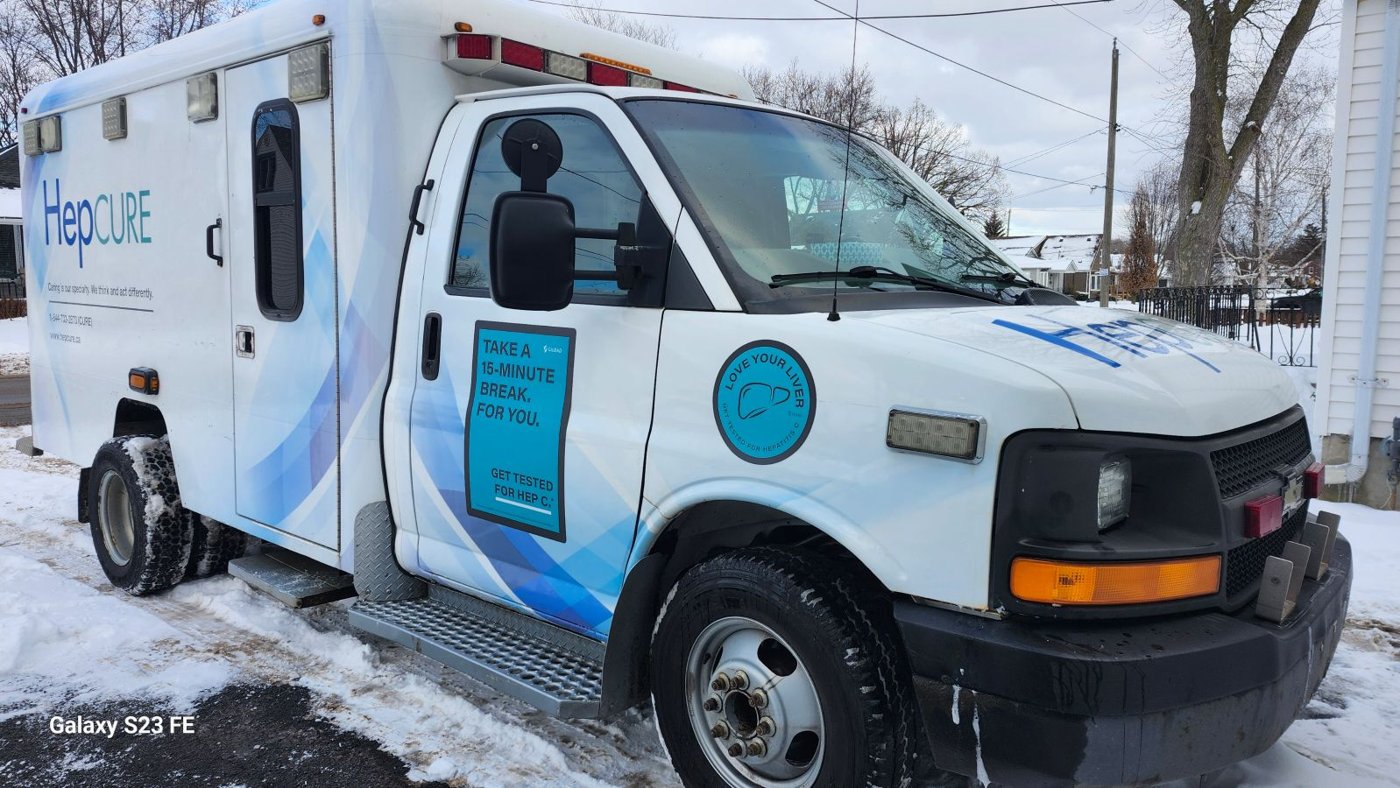
    Provide "Take A 15-Minute Break. For You." campaign collateral — one outreach event advertising and education kit per location, unless materials can be re-used as per HepCURE's guidance.
    Take 15 campaign — HepCURE mobile unit with on-site A-frame signage
    Mobile unit · On-site signage
    Take 15 campaign — HepCURE mobile unit vehicle wrap decals
    Vehicle wrap · Campaign decals
    Campaign material displayed on HepCURE
    mobile units at screening events.
  • Dedicated liaison
    Associate Director of Community Marketing — 0.25 FTE as liaison between the HepCURE Collaboration responsible person (project manager) and Gilead.
  • Supply coordination
    Coordinate and arrange for the "Take A 15-Minute Break. For You." campaign supplies to be sent to HepCURE screening locations.
  • Technical expertise & knowledge sharing
    Provide scientific and clinical insights to support evidence-based strategies for hepatitis C screening, linkage to care, and treatment best practices.
  • Collaboration building
    Foster strong partnerships with HepCURE and other stakeholders to enhance coordination, share learnings, and align efforts for maximum community impact.
  • Program support & guidance
    Offer guidance on optimizing outreach and engagement models based on global learnings and community-focused approaches.
  • Monitoring & evaluation
    Work jointly with HepCURE to define key performance indicators and share methodologies for measuring program impact and improving outcomes.
  • Van decal advertising
    Decal advertisement for the HepCURE van — HepCURE to display during the period of the agreement.
HepCUREConfidential — Do not copy or distribute
For discussion
Partnership
Gilead's Roles & Responsibilities
For Discussion
  • Monthly disbursement
    Operational costs are incurred every month, while milestone funding is currently released quarterly. As part of the 2027 funding conversation, we would welcome a discussion about moving to a regular monthly payment cadence so that funding aligns with ongoing operating expenses and avoids extended gaps between disbursements.
  • Cartridge & POCT supply support
    Cepheid GeneXpert® cartridges and POCT kits are now central to expediting the screening of qualified individuals, yet this cost sits outside the current collaboration and no alternative funding channel is available (the manufacturer will not extend credit to smaller organizations). As Gilead has previously funded POCT kits for screening, we would value a conversation about incorporating this supply as part of the collaboration's mandate going forward.
  • 2027 funding continuity
    As we receive no public funding and rely primarily on supply-partnership support, we would appreciate an early conversation about funding for 2027 and Gilead's expectations. Ideally we would have clarity by the end of Q3 2026, so that meeting this year's requirements is not followed by uncertainty about continuity into the next year.
HepCUREConfidential — Do not copy or distribute
Accountability
Financial Accountability
Line item% of fundingAmount
Sponsorships (received to date)
Gilead sponsorship20.2%$130,790
Other sponsorship #127.8%$180,000
Other sponsorship #227.8%$180,000
CRM sponsorship ($3,000 / month · 12 months annualized)5.6%$36,000
New mobile unit sponsorship (leasing / repairs · full-year support)9.3%$60,000
British Columbia expansion sponsorship (Q3 + Q4 2026)9.3%$60,000
Total funding received100%$646,790
Costs
Project Management−$17,280
Outreach Events (76 days · $3,000 / day)−$228,000
Post Outreach — treatment linkage (149 clients · 1 hr · $65 / hr)−$9,685
Post Outreach — LTFU case management (72 clients · 1 hr · $65 / hr)−$4,680
Management ($30,000 / month · 6 months)−$180,000
CRM subscription ($3,000 / month · 12 months annualized)−$36,000
New mobile unit — leasing / repairs (6 of 12 months amortized · $60,000 / yr)−$30,000
Staff severance−$30,000
Total costs−$535,645
Net position (accounting view)+$111,145
Post-outreach engagement to date — 221 / 400 target clients (149 linked to treatment + 72 LTFU case-managed) against a 40 / month goal. Deferred obligations and the debt-adjusted net position are shown on the next slide.
HepCUREConfidential — Do not copy or distribute
Accountability · Continued
Deferred Obligations & Adjusted Net
Advanced funding still to be repaid — the other half is already reflected in year-to-date expenses on the prior slide.
Line itemAmount
Starting position
Net position (from prior slide)+$111,145
Deferred obligations (remaining half — debt owed)
CRM sponsorship — repayment owed−$18,000
Mobile unit sponsorship — repayment owed−$30,000
British Columbia expansion — future obligation (Q3 + Q4 spend not yet realized)−$60,000
Adjusted net position (after remaining debt owed)+$3,145
Full sponsorship payment schedule is shown on the next slide.
HepCUREConfidential — Do not copy or distribute
Accountability
Sponsorship Payment Schedule
Gilead sponsorship payments received to date and remaining, against total funding of $237,800.
PaymentDateAmountStatus
Project initiationJanuary 22, 2026$59,450Received
Project planJune 11, 2026$23,780Received
Q1 paymentJune 11, 2026$47,560Received
Q2 paymentTo be issued$47,560Pending
Final paymentDue October 31, 2026$59,450Owed
Received to date$130,790
Outstanding — $107,010: a Q2 installment of $47,560 to be issued, plus a final payment of $59,450 due by October 31, 2026.
HepCUREConfidential — Do not copy or distribute
Placeholder · Q4 2026
Forward Reporting
New Data Markers — July 2026 Rollout
Q1Jan–Mar
Q2Apr–Jun
Q3Jul–Sep
Q4Oct–Dec
Implementation starting July 2026 — resourcing constraint. The two data markers below were identified as valuable additions to the reporting cadence but could not be operationalized in Q2 or Q3 due to limited case-management & data-entry resourcing — the same constraint outlined in the SWOT Weaknesses slide. HepCURE will begin capturing these markers in July 2026 and include them in every quarterly report thereafter, giving Gilead continuity across all subsequent reporting cycles.
Marker 1
Prior HCV Exposure Markers
Total Registered
Pending Q4
Prior HCV Ab+ Exposure
count · %
Prior Confirmatory RNA+
count · %
Previously Treated
count · %
Marker 2
Time to Treatment Start
Same day
count · %
Within a few days
count · %
Within a few weeks
count · %
Within a month
count · %
MonthSame dayFew daysFew weeksWithin monthTotal
Oct
Nov
Dec
Q4 Total
HepCUREConfidential — Do not copy or distribute
Section 13

INHSU 2026 Abstract

Slide 65
Top
13of 13
INHSU 2026 · Abstract Submission
The Missing Layer in HCV Elimination:
How an AI-Enabled CRM Doubled RNA-Positive Yield and Delivered 84.3% Linkage-to-Care in a Mobile Program for People Who Use Drugs
C. Marcoux¹
¹HepCURE Program (Technology & Data Systems Consultant), Ontario, Canada  ·  Presenting author: C. Marcoux
Category: Models of Care and Programs  ·  Format: Background / Description of the model of care / Effectiveness / Conclusions and next steps  ·  Word count: 290 / 300
Background

Micro-elimination of HCV among people who use drugs (PWUD) remains constrained by fragmented data, manual case-management workflows, and diagnostic-yield variance. Despite the availability of curative direct-acting antivirals and point-of-care diagnostics, most programs still rely on paper trails, siloed spreadsheets and clinician memory — creating avoidable losses along the cascade of care.

Description of the model of care

HepCURE deployed a purpose-built CRM engineered mobile-first for tablet and smartphone use — traditional laptops are impractical in mobile outreach. It integrates client registrations, HCV / HIV POCT, Cepheid RNA confirmatory testing, DBS, dispositions and case management into a single longitudinal record. An AI layer classifies each client's cascade position in real time, flags follow-up drift, models optimal outreach geography, and produces reconciled sponsor scorecards. A conversational AI agent answers natural-language questions on any collection point, rendering results as dashboard visuals. Customizable data markers extend the schema on-demand, capturing emergent variables and surfacing live insights to refine the model of care. Two mobile teams operated Jan–Jul 2026 across 29 Ontario communities and 144 outreach days.

Effectiveness

2,590 at-risk clients were screened; 415 (16.0%) confirmed RNA-positive, of whom 350 (84.3%) were linked to care. Team-level analytics revealed a 1.9× yield differential (Team 2: 23.5% vs Team 1: 12.6% RNA-positive rate) that directly informed screening-protocol refinement. 3,450 clinical assessments (1.33 per client) were tracked across POCT HCV, POCT HIV, Cepheid and DBS modalities with zero reconciliation errors between team-level and program-wide reporting.

Figure 1 · HepCURE cascade of care · Jan–Jul 2026
Clients screened
2,590 · 100%
POCT Ab-positive
1,108 · 42.8%
RNA-positive
415 · 16.0%
Linked to care
350 · 84.3% of RNA+
Bar widths reflect share of the 2,590-client screened cohort; the final bar is annotated with the linkage rate against the 415-client RNA-positive denominator. AI-driven team-yield analytics (Team 2: 23.5% vs Team 1: 12.6% RNA+ rate) drove screening-protocol refinement mid-year.
Conclusions and next steps

AI-enabled, CRM-driven workflow is the missing operational layer in HCV elimination for PWUD — turning static outreach data into a real-time optimization loop that elevates decision-making, surfaces yield variance, compresses the cascade and eliminates reporting drift. The platform is model-of-care agnostic and directly replicable in other Canadian jurisdictions and internationally. To our knowledge, this is the first HCV / HIV elimination abstract centered on AI and CRM technology.

Disclosure of interest: The author declares no conflicts of interest.  ·  Funding: The HepCURE program is supported by Gilead Sciences Canada Inc. Gilead had no role in study design, analysis or preparation of this abstract.  ·  Ethics: Program-level analysis of aggregated, de-identified client data; REB / program-evaluation approval to be confirmed at submission.  ·  AI use: AI writing tools were used to refine language and clarity; all content, analysis, and interpretation are the author's own.
HepCUREConfidential — Do not copy or distribute